WagerMate V4 ROI

In addition to the new filters I mentioned yesterday, WagerMate 4.0 has a lot of improvements in how it evaluates horses, and runs its simulations.

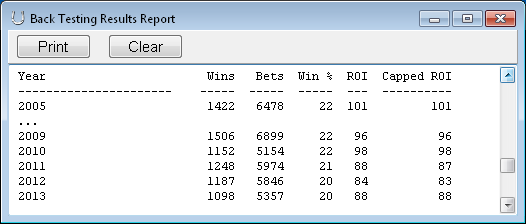
Here are the back testing results on my 2009-2017 data, with the default filters:

V4 Default 2009-2017

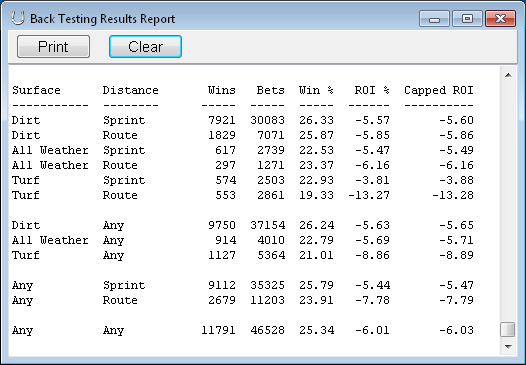
If you did no handicapping of your own, and simply bet on the 46,528 races that WagerMate told you to, you’d have won 25.34% of those races and lost 6.01% of your money.

Compare that to your competition — if they bet blindly, they’d lose 15% or 20% (the track’s takeout) — so you have a huge head start.

I hope you can use WagerMate’s filters AND your own expertise to get results that are even better than the WagerMate default selections.

Best of luck!

Now and Then

This report, using the default settings, shows the ROI per year on my test data…

2005 to 2013 ROII see a sudden drop-off in performance after 2010.  I blame the rise of the computers.  Our competition has gotten stronger, so we have to work harder than ever to make a profit.

I’m going to drop the 2005 data from my standard back testing.  Partly because it’s old, but mostly because it makes WagerMate look too good.  I want my back testing to be as realistic as possible.

P.S. Oops, I try to remember to use the ROI switch that says “1% means a 1% profit”, but in this figure I had it set to “101% means 1% profit”.  Sorry.

WagerMate’s Performance — Build 318

Part of the process of releasing a new version of WagerMate is back testing.  This figure shows how the new Build 318 of WagerMate performs, using the default strategy.  This is based on about four year’s worth of data.

318 Back Test Report

318 Back Test Report

So, if you blindly followed all of WagerMate’s suggestions, you would have won about 22% of your bets and got back 96% of the money you bet (i.e. a 4% loss).

In one sense, that’s terrible — we’d lose money!  But in another sense, this is incredibly encouraging — before we’ve even applied a bit of our handicapping skill, we’ve changed the rules of the game.  Everyone else is playing a game with a 20% takeout, but WagerMate users are playing a game with a 4% takeout.

If you can use your own experience and wisdom to sort through WagerMate’s selections, you should be able to improve on these results.  If you have enough data to do your own back testing, you should be able to develop a better strategy than the default strategy built into WagerMate.

Of course, Your Mileage May Vary.  Making money in back testing is not identical to making money with real bets.

Build 318

I uploaded a new version of Wagermate today.  Most of the enhancements are minor.

Here’s something convenient: when you’re working on the back testing tab to perfect a strategy, you can make it apply to just dirt races or just sprints (for example) by using the new checkboxes.

Back test tab with new checkboxes

Back test tab with new checkboxes

I’ve taken to saving my strategy files with names that indicate what surface and distance they pertain to, like “DS long shots.wmst”.

A First Strategy

If you follow WagerMate’s out-of-the-box betting advice, it will do a reasonable job of handicapping — but, you’ll be placing the same bets as every other WagerMate user.

I hope you’ve learned how to use WagerMate’s filters to develop your own strategies and how to save them as WMST (WagerMate STrategy) files.  Strategy files let you bring your own personal experience and wisdom into the WagerMate handicapping process — you’re customizing the process.  It’s easy:

  1. Click Start Handicapping, and let the simulations finish…
  2. Set some filters
  3. Click Save Strategy

Here’s a very simple strategy applied to the 2012 races to date…

Main screen with a filter

Main screen with a filter

…it simply sets the filters for Recency, Maximum Morning Line Odds, and Good Last Race Required.  Using this strategy for back testing  on the races run so far in 2012 yields:

Sample Back Testing Report

Sample Back Testing Report

Does this mean you can expect a 20% profit (an ROI of 120%), turn pro, and live happily ever after?  Possibly not….

A few things to keep in mind:

  1. This is a tiny sample — just 41 races.  My experience is that we need a back testing strategy that works on hundreds of races before we start to have faith in it.
  2. When I applied this simple filter to my entire set of data (about 4 year’s worth of cards and charts) the results weren’t quite as good:

    Back Test Report on large sample

    Back Test Report on large sample

  3. Although the average profit for the 4 years was 5%, the best year showed a profit of 23% and the worst year showed a loss of 7% — so the road to riches is not smooth.
  4. Just because something works in back testing doesn’t mean it will work in the future.

You can download the related strategy file.